Our NYC Crisis Monitor, built with ANHD, JustFix, BetaNYC, and other members of the OCA Data Collective, shows the rate of tenant representation in eviction cases and how many New York City tenants have been evicted since the end of protections on January 15, 2022. For New York State data, visit this page.
Evictions are inhumane, unjust, and violent - and are rooted in long histories of economic, gender, and racial injustice. Evictions are about POWER and for many landlords, especially the worst evictors, evictions are an integral part of their business model. The COVID-19 pandemic has worsened the fear, threat, and devastating impacts that evictions have on our neighborhoods, homes, and families.
Before the pandemic, one way the tenant movement addressed this crisis was by passing Right to Counsel for tenants facing eviction in 2017. By all metrics, RTC works: evictions plummeted, landlords sued tenants less and almost EVERYONE who had Right to Counsel stayed in their home.
During the COVID-19 pandemic, New York enacted one of the strongest eviction bans in the country thanks to the tireless organizing of the tenant movement - NYC went almost two years with almost no evictions, making an Eviction Free NY a reality!
Now, all of that is at risk. New York's eviction protections expired in January 2022 and the national labor shortage has hit the non profit legal services community hard. Instead of adjusting court calendars, the courts are doing the opposite and scheduling eviction cases FASTER than legal services have capacity to handle them, denying THOUSANDS of tenants their legal right to representation. The charts below show just how bad this crisis is. It is absolutely outrageous.
THOUSANDS OF TENANTS ARE FACING EVICTION ALONE!
Since the expiration of the eviction protections in January 2022, over 124,000 tenants have been facing their eviction in court alone, when almost all of them should have an attorney! And it's only getting worse - the percentage of tenants with an attorney has been rapidly falling. The courts are denying tenants their legal right to representation by scheduling cases faster than legal services can handle. The result? Thousands of tenants are being denied their rights and being evicted.
Eviction cases with and without representation since January 15, 2022
| Represented | Unrepresented | Total Cases |
|---|---|---|
| 88,180 | 124,124 | 212,304 |
THOUSANDS OF TENANTS ARE BEING EVICTED!
Since the eviction protections ended, court-ordered marshals have evicted more than 45,000 households, and that number doesn't include all the tenants who self-evict. The chart below shows the current number of households who have been evicted since January 15, 2022.
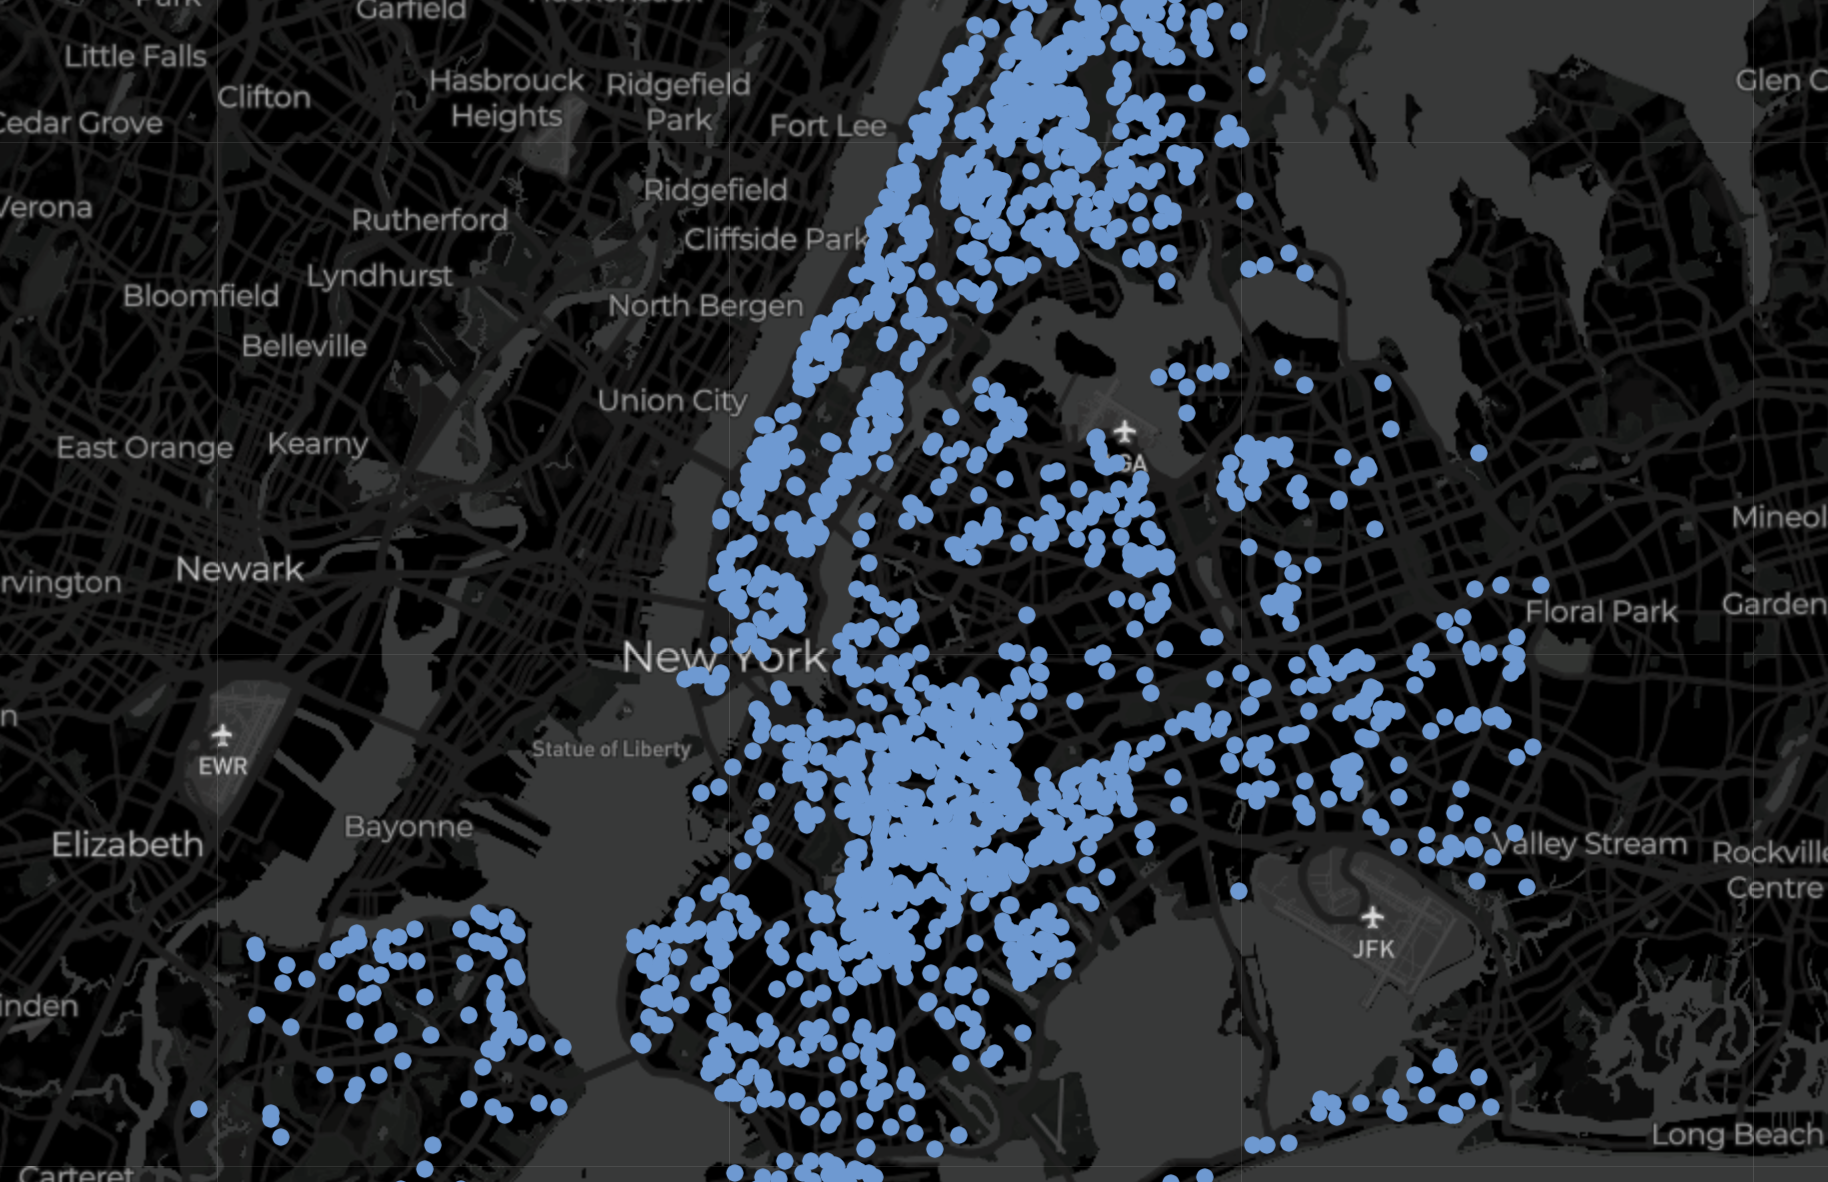
Click this link to go to DAP Portal and see a map of where tenants have been evicted across New York City since protections expired!
TAKE ACTION!
To stop this crisis, we need you to TAKE ACTION TODAY and join our DEFEND Right to Counsel campaign. You can sign up for email updates here. For resources and a guide on how to fight your eviction case if you are unrepresented or were denied Right to Counsel, click here!
Find out exactly where tenants are facing eviction so you can organize and stop evictions in your neighborhood! Use ANHD's DAP Portal to search for buildings where tenants are at immediate risk of eviction.
Methodology and Notes
Numbers in the red text above above were last updated March 21, 2024. The charts update with new data automatically as it becomes available.
The Share of Represented Tenants chart shows the number of nonpayment and holdover cases with at least two court appearances that occurred at least one week before the current date in which any listed defendants had counsel, divided by all such nonpayment and holdover cases. This figure is considered the "representation rate." Representation rates are shown by the week they were filed, meaning the rate for cases can increase retroactively if attorneys are assigned, given that the chart updates with new data automatically. Instances where defendants did not appear in court are excluded.
Methodology updates:
On October 31, 2022, we adjusted our methodology to include cases with at least two previous appearances instead of one, in order to exclude cases where a tenant has only done intake. This makes the representation rate and overall number of cases without representation a more conservative estimate. Cases that close before a second appearance, included where tenants self-evict, are therefore not included.
On December 21, 2022, we adjusted our methodology to exclude duplicate appearance records, which falsely treated cases with just one "real" previous appearance as having more than one previous appearance. We also exclude weeks in which the total cases are fewer than 100 from the Share of Represented Tenants chart in order to show representation rates based on a substantial sample of cases.